Introduction
The 2024 U.S. presidential election presented an intriguing scenario where the Republican Party secured a decisive victory despite facing a higher proportion of negative sentiment on social media. This report analyzes data collected exclusively from X/Twitter using Upfluence, which scoured through millions of tweets and filtered them with friendly language inclusion to ensure the credibility of data procurement. We examine how negative sentiment did not hinder the Republican Party’s success, focusing on percentage data, engagement metrics, and daily analysis to illustrate key insights.
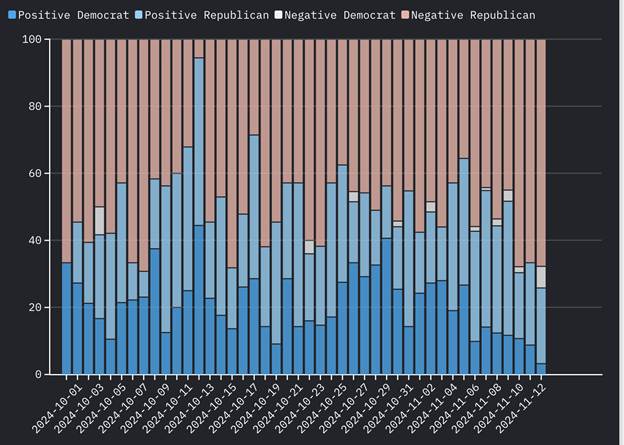
Data Overview
Sentiment Analysis Results
Republican Party:
- Positive Sentiments: 36.71%
- Negative Sentiments: 63.29%
Democratic Party:
- Positive Sentiments: 94.86%
-
Negative Sentiments: 5.14%
Percentages are calculated based on the total sentiments expressed towards each party.
Political Alignment of Influencers
From total influencers:
- Republican Influencers: 60.81%
- Democratic Influencers: 34.59%
- Neutral Influencers: 4.59%
Election Results
Republican Candidate (Donald Trump):
Electoral Votes: 57.93%
Popular Vote: 50%
Democratic Candidate (Kamala Harris):
- Electoral Votes: 41.93%
- Popular Vote: 48.3%
Electoral vote percentages are based on the total available electoral votes.
Influencer Engagement and Audience Demographics
Metric | Democrat | Republican |
Total Engagement | 730 million | 2 billion |
Average Daily Engagement | 16.6 million | 49.6 million |
Total Followers | 261 million | 324 million |
Average Follower Count per Influencer | 2.1 million | 1.4 million |
Average Retweets per Influencer | 123 | 1,939 |
Average Audience Gender – Male | 48.73% | 52.24% |
Average Audience Gender – Female | 51.27% | 47.76% |
Average Fake Audience Percentage | 13.37% | 13.84% |
Average Audience Age Bracket 0-17 | 4.85% | 5.61% |
Average Audience Age Bracket 18-20 | 4.33% | 4.34% |
Average Audience Age Bracket 21-24 | 8.10% | 8.86% |
Average Audience Age Bracket 25-34 | 50.77% | 48.16% |
Average Audience Age Bracket 35-54 | 29.58% | 31.61% |
Average Audience Age Bracket 54+ | 3.44% | 3.95% |
Daily Engagement Analysis
The daily engagement data for both parties between September 30, 2024, and November 12, 2024, shows fluctuations in user interactions on X/Twitter.
Daily Engagement Figures (Selected Dates)
Date | Democrat Engagement | Republican Engagement |
2024-09-30 | 7,317,432 | 2,402,379 |
2024-10-04 | 30,105,234 | 81,860,949 |
2024-10-08 | 43,546,860 | 47,855,718 |
2024-10-17 | 53,462,295 | 40,398,237 |
2024-10-20 | 121,321,764 | 67,997,124 |
2024-10-25 | 134,947,215 | 36,684,972 |
2024-11-05 | 29,529,819 | 247,933,071 |
2024-11-06 | 10,098,234 | 452,081,763 |
Note: The full dataset is available in the appendix.
Analysis
1. Sentiment vs. Election Outcome
Despite receiving a higher proportion of negative sentiments:
- The Republican Party won 57.93% of the electoral votes.
- Secured 50% of the popular vote, surpassing the Democratic Party.
In contrast, the Democratic Party, with a significantly higher proportion of positive sentiments (94.86%), did not achieve electoral success commensurate with the positive public sentiment on social media.
Insight: Negative sentiment on X/Twitter did not translate into a loss of electoral support for the Republicans.
2. Influence of Political Alignment
- Republican-aligned influencers made up 60.81% of the total influencers, nearly double the Democratic influencers at 34.59%.
- This suggests that Republican messaging had a broader reach on social media platforms.
3. Engagement and Visibility
The daily engagement data reveals significant trends:
- Overall Engagement Trends: Republican engagement frequently surpassed Democratic engagement, with notable spikes on specific dates.
- Key Engagement Spikes:
- October 2: Republican engagement surged to 66M coinciding with the vice-presidential debate on October 1.
- October 4: Both parties saw increased engagement, with Democrats at 30,105,234 and Republicans at 81M.
- October 20: Democrats peaked at 121M, while Republicans had 67M.
- November 5 (Election Day): Republican engagement reached 247M, significantly higher than the Democrats’ 29M.
- November 6 (Post-Election): Republican engagement spiked to 452M, while Democrats recorded 10M.
Insight: The Republicans’ higher engagement levels, especially during critical campaign events and after the election, indicate a highly active and responsive supporter base.
4. Correlation with Campaign Events
Analyzing the daily engagement data alongside the campaign timeline reveals correlations between events and engagement spikes:
- October 2-3: The vice-presidential debate and subsequent discussions likely contributed to increased Republican engagement.
- October 20: The Democratic engagement peak coincides with significant campaign activities, possibly the culmination of voter mobilization efforts.
- October 25: A substantial Democratic engagement spike aligns with media endorsements and political controversies, such as The Washington Post’s decision not to endorse a candidate.
- November 5-6: The election results prompted massive engagement, with Republicans showing a dramatic increase post-election.
Learning: Significant campaign events, debates, and controversies directly impact social media engagement, influencing public discourse and visibility.
5. Influencer Reach and Audience
- Total Followers: Republican influencers have a higher collective follower count (324 million) than Democrats (261 million).
- Average Follower Count per Influencer: Democratic influencers have more followers on average (1 million) compared to Republicans (1.4 million).
- Average Retweets per Influencer: Republicans average 1,939 retweets, significantly higher than Democrats’ 123 retweets.
Impact: Republican influencers, despite having fewer followers per influencer, achieved higher engagement through more frequent retweets and interactions, amplifying their reach.
6. Audience Demographics
- Gender Distribution: The Republican audience is slightly more male (52.24%), while the Democratic audience is slightly more female (51.27%).
- Age Brackets:
- 25-34 Age Group: Largest segment for both parties.
- Republicans have marginally higher percentages in older age brackets (35-54 and 54+).
7. Voter Mobilization and Turnout
- Engagement Metrics: High engagement and retweet rates among Republican influencers suggest effective mobilization of supporters.
- Post-Election Engagement: The significant spike in Republican engagement after Election Day indicates sustained supporter activity.
8. Impact of Campaign Events on Engagement
Key events from the campaign timeline had noticeable effects on engagement:
- October 25: Democratic engagement spiked amid media events and endorsements, reflecting increased supporter activity.
- October 27-31: Controversies involving both candidates led to fluctuations in engagement, with Republicans maintaining higher levels.
- November 5-6: Election results drove massive engagement, highlighting the importance of outcome-driven discussions.
Learning: Campaign controversies and pivotal events can both positively and negatively affect engagement, depending on public perception and media portrayal.
9. Limitations of Sentiment Analysis
- Discrepancy with Engagement: Despite negative sentiment, Republicans maintained higher engagement, suggesting sentiment analysis alone does not predict electoral outcomes.
- Voter Priorities: Voters may prioritize policy issues and candidate characteristics over social media sentiment.
Observations and Insights
Dominance in Social Media Engagement
The Republicans’ significantly higher total and daily engagement metrics indicate a dominant presence on X/Twitter, potentially offsetting negative sentiments through sheer volume of interaction.
Effectiveness of Republican Influencer Strategy
Despite Democratic influencers having more followers on average, Republican influencers’ higher engagement and retweet rates suggest more effective content dissemination and audience interaction.
Correlation Between Events and Engagement
The analysis shows that specific events, especially controversies and debates, had a direct impact on engagement levels, influencing public discourse and potentially voter behavior.
Audience Demographics and Voter Turnout
The Republicans’ slightly older audience demographic aligns with age groups that traditionally have higher voter participation, possibly contributing to their success at the polls.
Engagement Over Sentiment
High negative sentiment did not impede the Republicans’ ability to engage users effectively, indicating that engagement metrics may be a more critical factor than sentiment in predicting electoral outcomes.
Conclusion
The 2024 election demonstrates that a higher proportion of negative sentiment on social media platforms like X/Twitter does not necessarily hinder electoral success. Despite facing 63.29% negative sentiment, the Republican Party secured the presidency and maintained control of Congress. Factors such as a larger percentage of aligned influencers, higher engagement rates, effective messaging strategies, and voter mobilization efforts likely contributed to overcoming negative sentiment.
Key Takeaways
- Negative Sentiment Isn’t Definitive: A higher proportion of negative sentiment towards a party on social media does not guarantee electoral defeat.
- Engagement Over Sentiment: High levels of engagement and interaction can outweigh negative sentiment, enhancing visibility and influence.
- Influencer Alignment Matters: A greater percentage of influencers supporting a party can amplify messaging and counteract negative perceptions.
- Event-Driven Engagement: Campaign events and controversies significantly impact engagement and can sway public discourse.
- Complex Voter Dynamics: Electoral outcomes are influenced by a range of factors, including campaign strategies, policy positions, and voter turnout efforts, beyond social media sentiment.
- Limitations of Social Media Data: Sentiment analysis on platforms like X/Twitter may not fully capture the nuances of the broader electorate’s opinions.
Data Source
Data for this analysis was gathered exclusively from X/Twitter using Upfluence, which scoured through millions of tweets and filtered them with friendly language inclusion to respect the credibility of data procurement.
Appendix
Full Daily Engagement Data
Date | Democrat Engagement | Republican Engagement |
2024-09-30 | 7,317,432 | 2,402,379 |
2024-10-01 | 9,214,335 | 3,774,483 |
2024-10-02 | 3,358,782 | 66,765,924 |
2024-10-03 | 791,730 | 22,790,880 |
2024-10-04 | 30,105,234 | 81,860,949 |
2024-10-05 | 797,373 | 15,558,606 |
2024-10-06 | 537,966 | 7,282,890 |
2024-10-07 | 148,941 | 23,480,523 |
2024-10-08 | 43,546,860 | 47,855,718 |
2024-10-09 | 1,656,648 | 18,729,117 |
2024-10-10 | 943,065 | 18,287,082 |
2024-10-11 | 24,613,740 | 39,546,315 |
2024-10-12 | 3,350,061 | 20,888,676 |
2024-10-13 | 14,934,798 | 11,038,392 |
2024-10-14 | 6,395,229 | 42,274,620 |
2024-10-15 | 19,026,315 | 35,106,984 |
2024-10-16 | 20,063,088 | 50,450,472 |
2024-10-17 | 53,462,295 | 40,398,237 |
2024-10-18 | 7,214,319 | 67,767,129 |
2024-10-19 | 1,983,087 | 32,768,046 |
2024-10-20 | 121,321,764 | 67,997,124 |
2024-10-21 | 11,209,734 | 43,861,671 |
2024-10-22 | 4,398,462 | 62,588,736 |
2024-10-23 | 14,434,965 | 96,778,989 |
2024-10-24 | 1,237,185 | 56,959,245 |
2024-10-25 | 134,947,215 | 36,684,972 |
2024-10-26 | 5,685,921 | 69,369,741 |
2024-10-27 | 19,634,562 | 73,115,325 |
2024-10-28 | 33,595,857 | 33,819,867 |
2024-10-29 | 14,280,039 | 11,613,123 |
2024-10-30 | 31,975,461 | 46,583,307 |
2024-10-31 | 258,039 | 75,086,271 |
2024-11-01 | 2,460,006 | 17,929,350 |
2024-11-02 | 27,017,829 | 51,478,695 |
2024-11-03 | 11,126,799 | 4,052,871 |
2024-11-04 | 957,942 | 30,337,281 |
2024-11-05 | 29,529,819 | 247,933,071 |
2024-11-06 | 10,098,234 | 452,081,763 |
2024-11-07 | 990,261 | 8,733,825 |
2024-11-08 | 258,210 | 4,464,981 |
2024-11-09 | 3,270,204 | 40,629,600 |
2024-11-10 | 1,047,717 | 775,827 |
2024-11-11 | 885,609 | 2,136,474 |
2024-11-12 | 829,350 | 891,252 |
Key Campaign Events Timeline
October 1-2: Vice-presidential debate; Republican engagement surges.
October 25: Media endorsements and controversies; Democratic engagement spikes.
October 27-31: Campaign controversies involving both candidates; engagement fluctuations.
November 5: Election Day; Republican engagement peaks.
November 6: Post-election results; Republican engagement reaches highest point.
References
Data for this analysis was gathered exclusively from X/Twitter using Upfluence, which scoured through millions of tweets and filtered them with friendly language inclusion to respect the credibility of data procurement.


