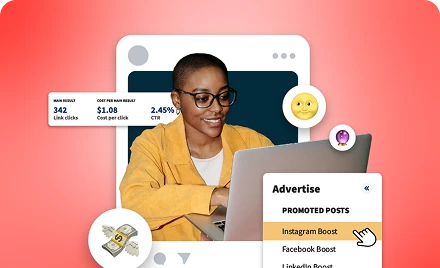

Get a Grip on Influencer Marketing
Hey There,
After months of designing, coding, and testing, we have released a new set of features to give our clients more insight around their influencer analytics! With our new Side Panel, users will be greeted by a stunning visualization of their influencer’s audience data and their social content with just one click.
New Features Include:
- A brand new influencer side panel packed with analytics.
- More data about influencer’s posts and engagements.
- Stats that show how influencers stack up against similar sized influencers.
- And many more UX updates!
Take a Look:
Influencer’s Audience City Data
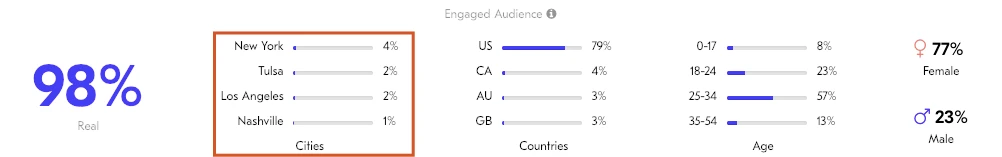
Starting with the Influencer’s Audience Data, Upfluence now provides you with the ability to view their current followers by not only their country but also their top cities. Functionality that becomes extremely important when more defined decisions need to be made for targeting specific groups of people for specific campaigns.
More Publication Data around your Influencers
We’ve also updated the amount of publications you can view from 3 to 9 for each Influencer profile you’re interested in vetting. You’ll be able to see their engagement rates per publication, as well as their estimated CPE, the dates each post have been made and also the hashtags that they’ve used.
Within the New Side Panel you get:
The Audience Dashboard
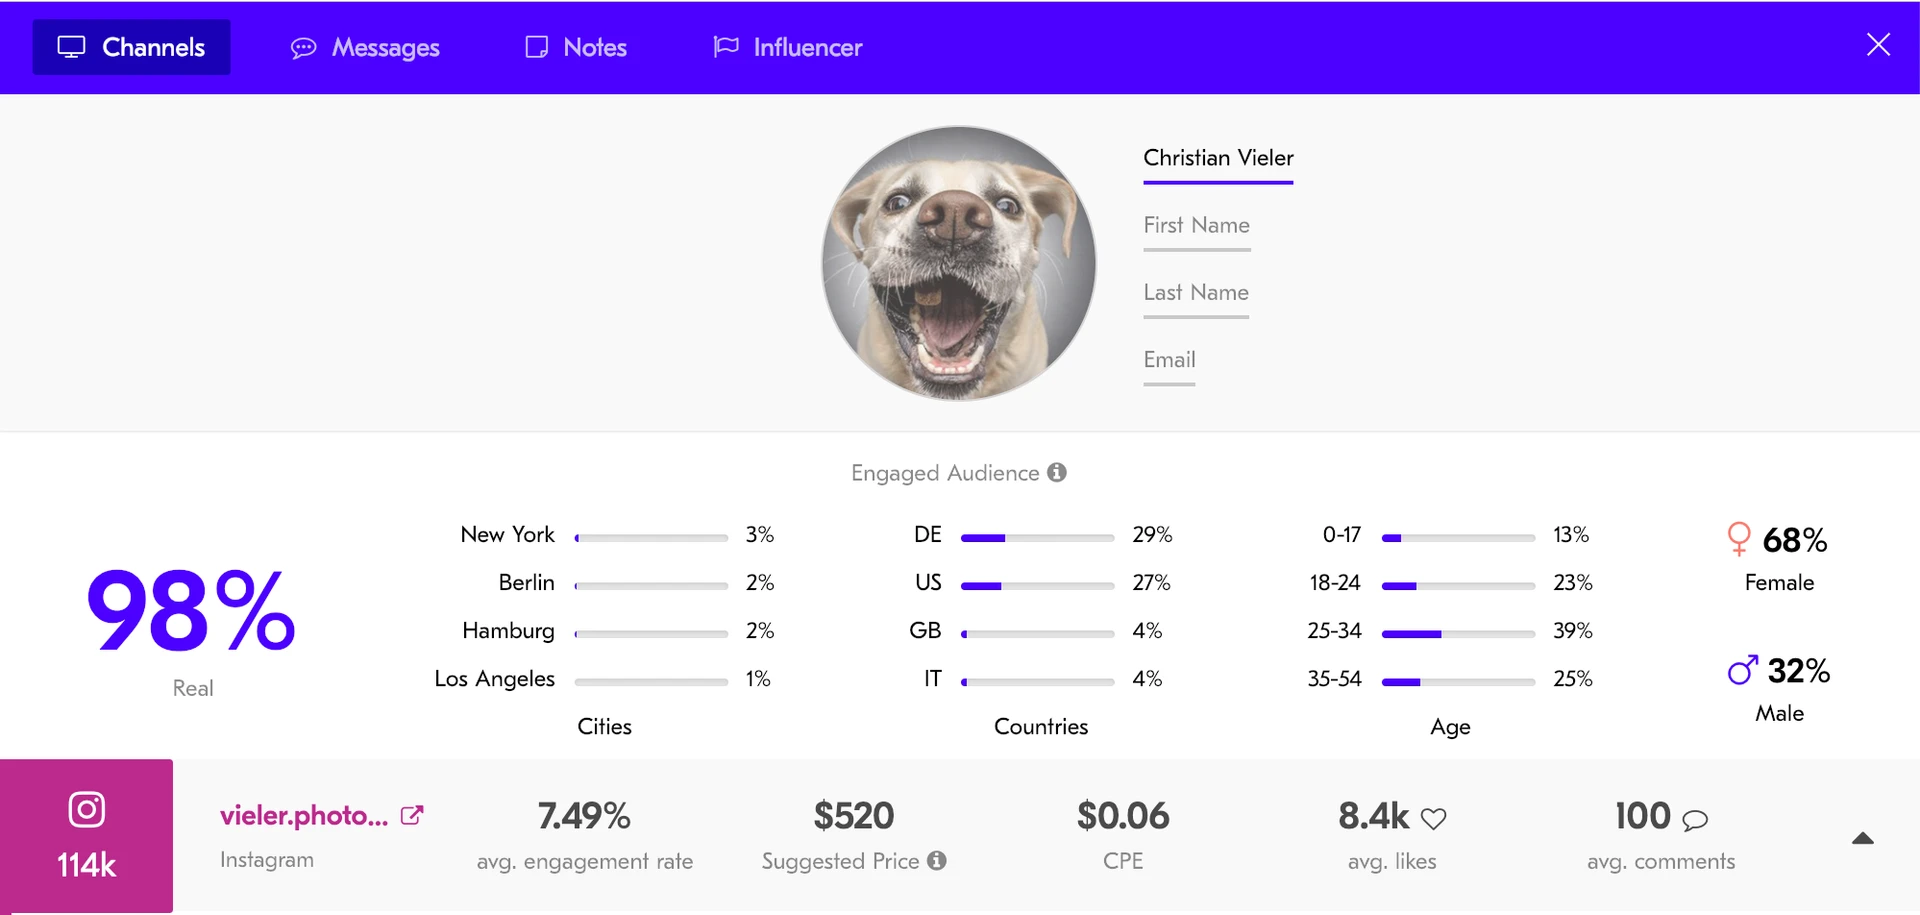
Content Summaries across multiple Social Platforms
Including:
- Comparative Engagement Data
- Social Post Performance Timeline
- Influencer Growth Graph
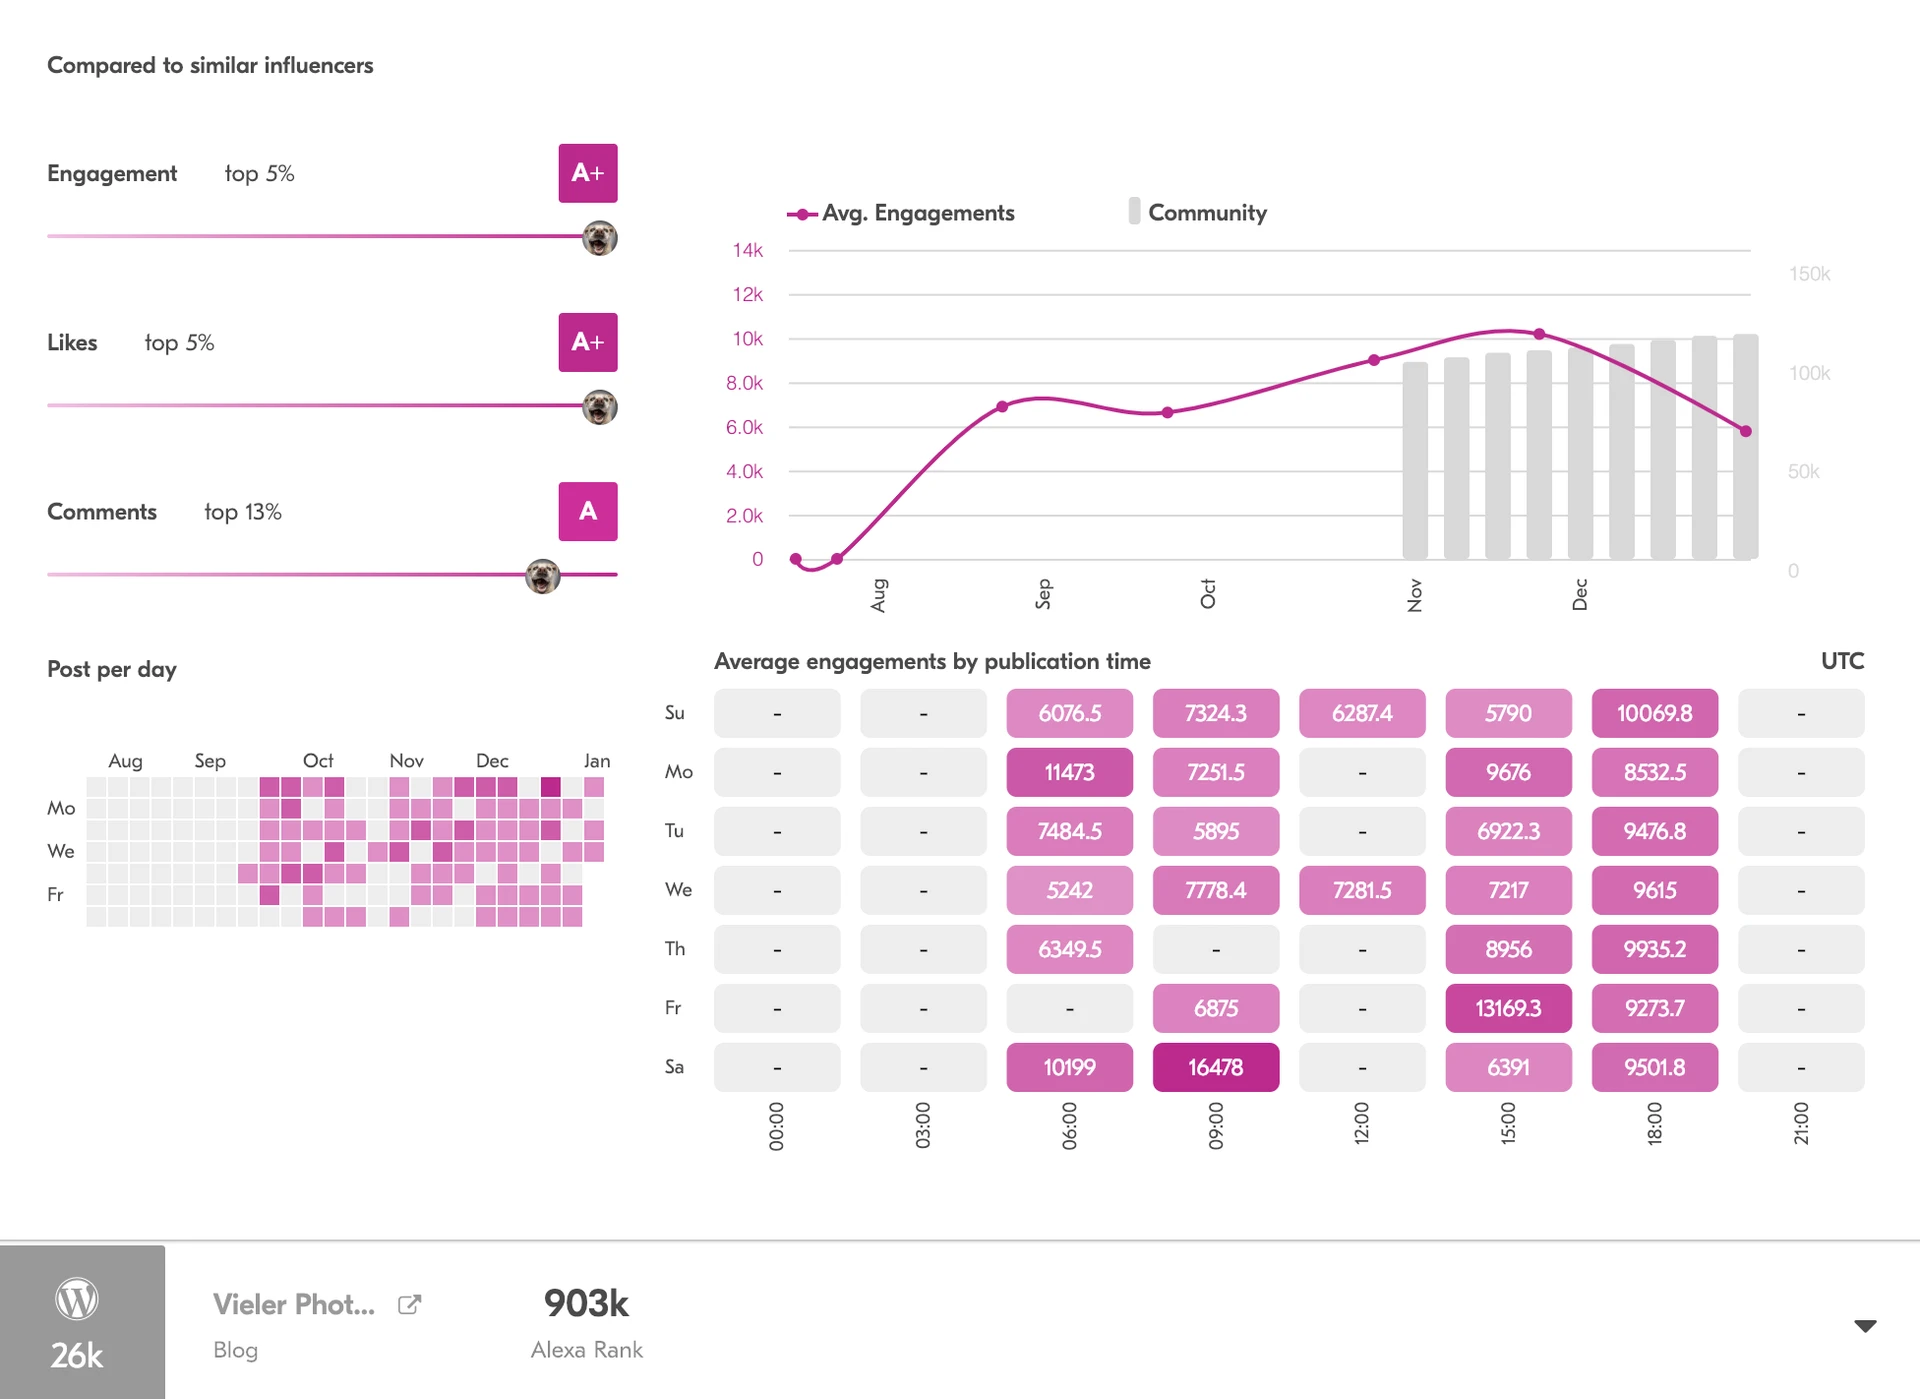
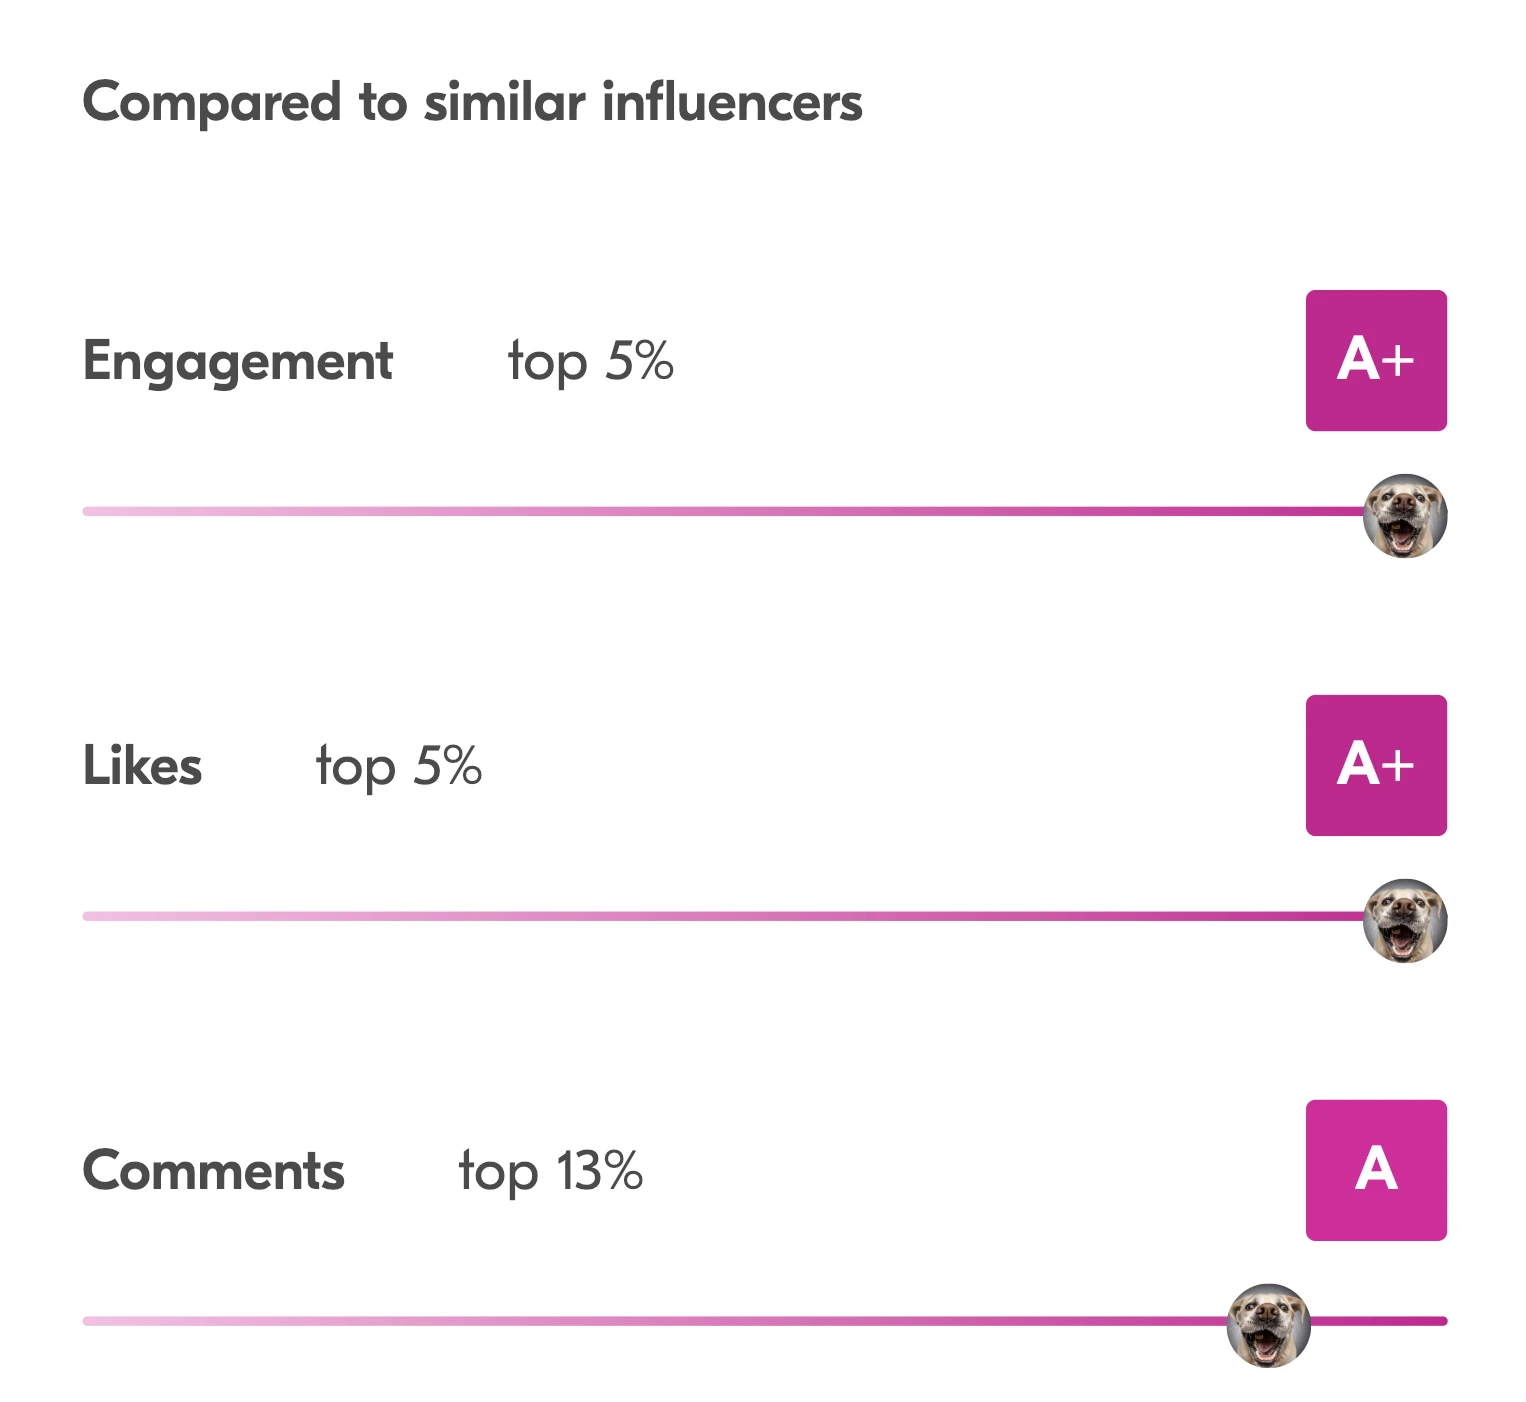
The Compared to Similar Influencers tool will allow you to see how your Influencers rank in comparison to others with a similar community size and engagement level.
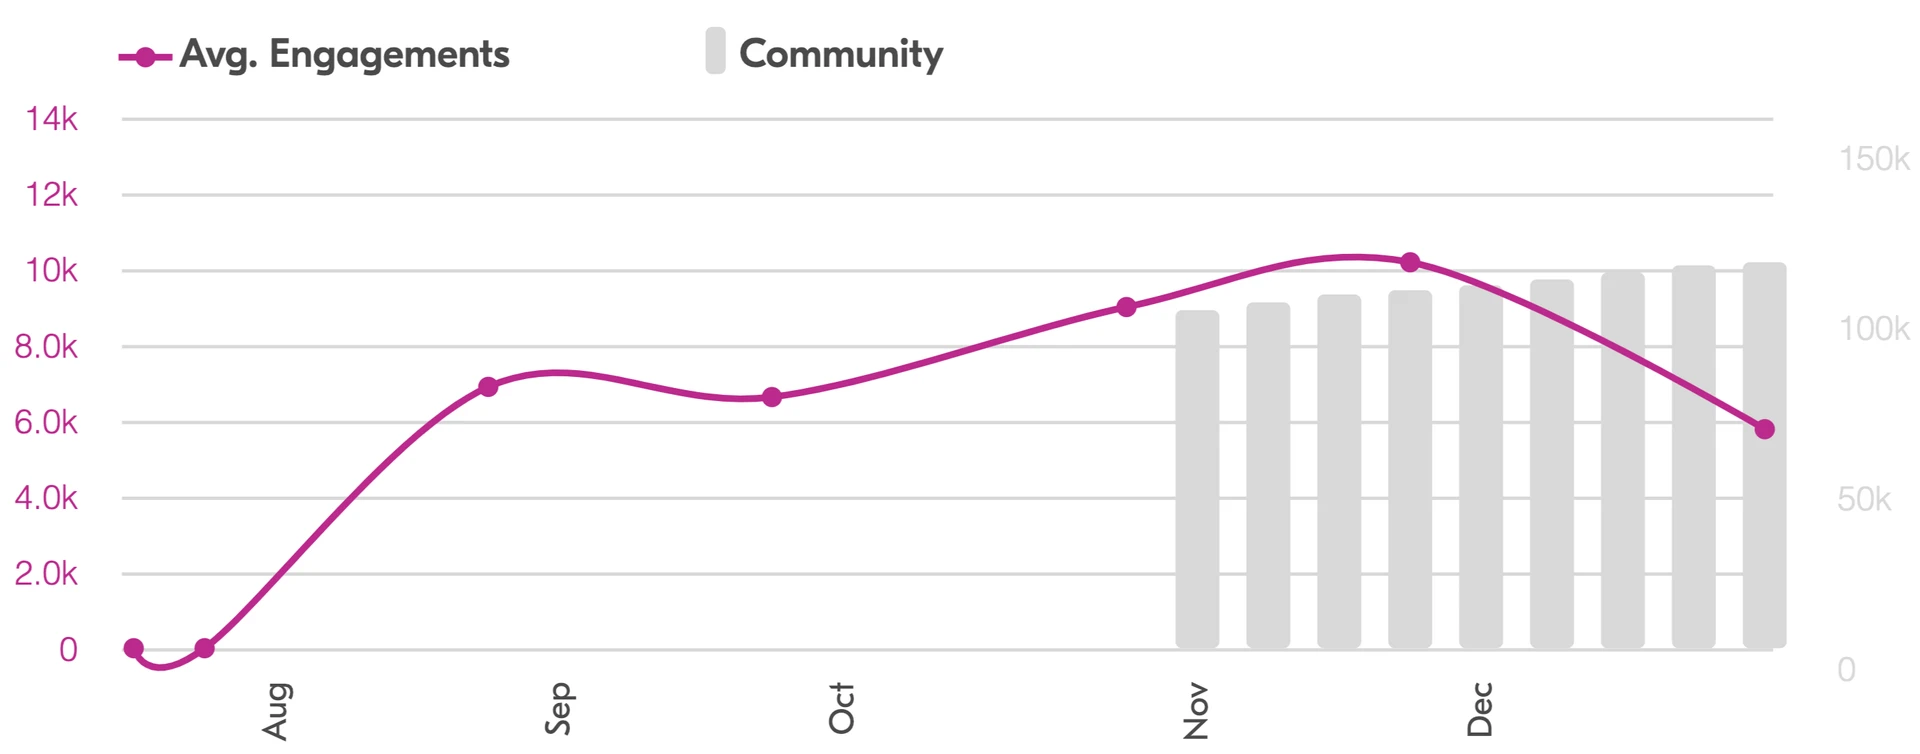
In addition, with the new engagement graph you will be able to see an influencers performance over recent months, as well as their audience count which would allow you to understand how their brand has evolved for better or worse.
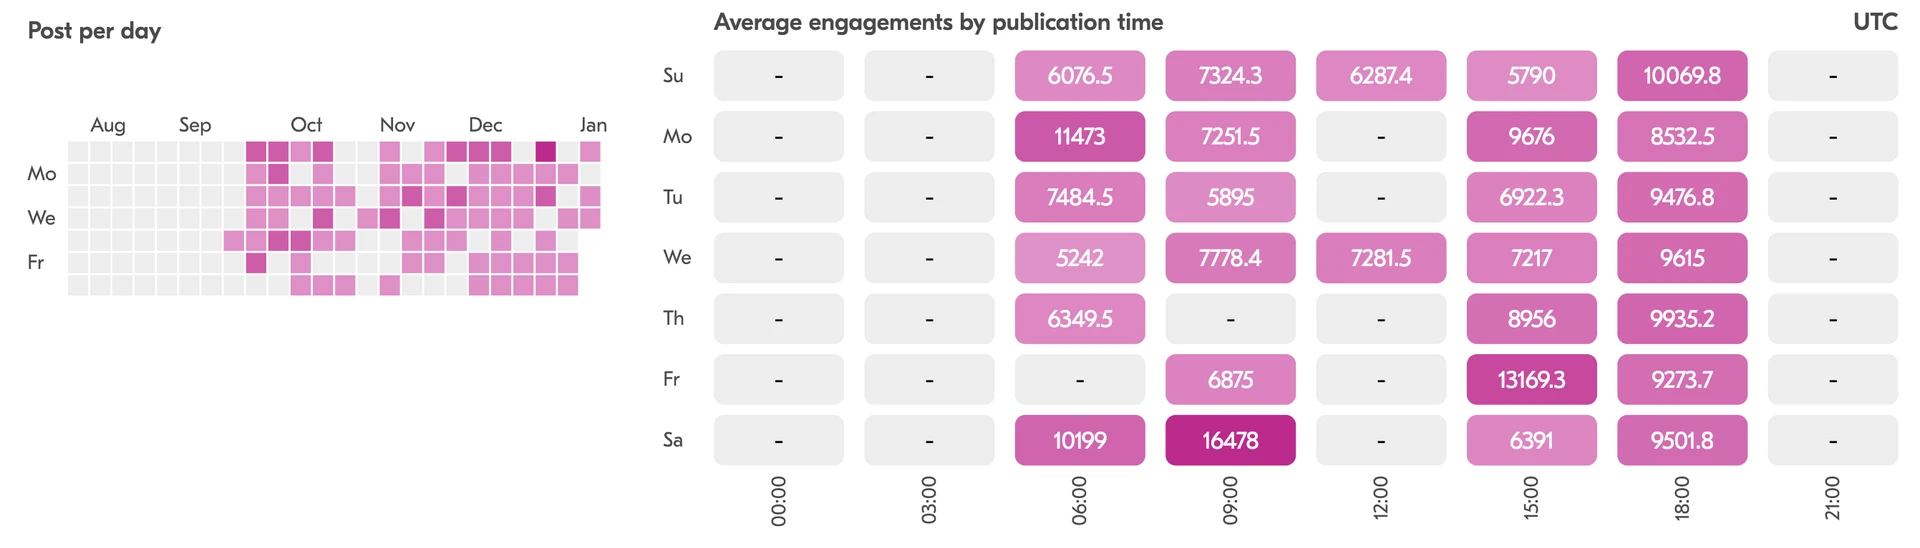
Finally, using a combination of the Posts per day and Average engagements by publication time graphs, you’ll have greater insight into when you and your influencer should consider posting for maximum exposure.
Influencer Marketing shouldn’t be a guessing game, especially when it comes to the right time to post
To learn more about the new features within the Upfluence Software, please feel free to contact your dedicated CSM.
We would love to schedule some time with you to answer any of your questions.
Thanks for your time and have a nice day!